When you pick up a prescription at the pharmacy, you might not think about how much it really costs the system - or how much it could cost if you chose differently. But behind every pill, there’s a story of money, competition, and decision-making that affects your health, your insurance, and your wallet. This is where cost-effectiveness analysis comes in - not as a dry economic term, but as a real tool that decides which drugs get covered, which get pushed to the back of the shelf, and which end up saving billions. Generic drugs aren’t just cheaper copies. They’re often the difference between someone taking their medicine and skipping doses because they can’t afford it. But here’s the twist: not all generics are created equal. Some cost five times more than others that do the exact same thing. And if you’re using cost-effectiveness analysis the wrong way, you might be paying more - without even knowing it. Let’s break down what this really means.
What Cost-Effectiveness Analysis Actually Measures
Cost-effectiveness analysis (CEA) isn’t about finding the cheapest drug. It’s about finding the best value. That means asking: How much health do we get for each dollar spent? In plain terms, analysts compare two or more treatments by looking at two things: how much they cost, and how much they improve health. The most common health outcome used is the quality-adjusted life year, or QALY. One QALY equals one year of perfect health. If a drug helps someone live 10 more years but with chronic pain, it might only count as 7 QALYs. That’s the adjustment. For generics, this gets interesting. The goal isn’t just to replace a brand-name drug with a generic. It’s to ask: Among all the generics available, which one gives us the most health for the least money? The FDA says that when the first generic enters the market, prices drop an average of 39%. When six or more generics are competing, prices fall over 95% below the original brand. That’s not just savings - that’s a market revolution. But here’s the problem: most studies ignore what happens next.The Hidden Cost of Ignoring Future Generics
A 2021 ISPOR conference report found that 94% of published cost-effectiveness analyses don’t account for future generic entry. That’s like predicting the price of a smartphone in 2025 based only on its 2020 price - and ignoring that Apple and Samsung will keep releasing cheaper models. Why does this matter? Because if you don’t factor in that a drug will soon have five generic versions, you’ll overestimate its long-term cost. That makes the drug look less cost-effective - even if it’s going to be dirt cheap in two years. The VA Health Economics Resource Center warns that this creates a bias: it makes new drugs look better than they are, and pushes decision-makers away from treatments that will soon become affordable. That’s backwards. If a drug’s patent is set to expire in 18 months, the analysis should reflect what it will cost after generics arrive - not what it costs today. That’s not how most analyses are done. And it’s costing the system money.Not All Generics Are Equal - Here’s Why
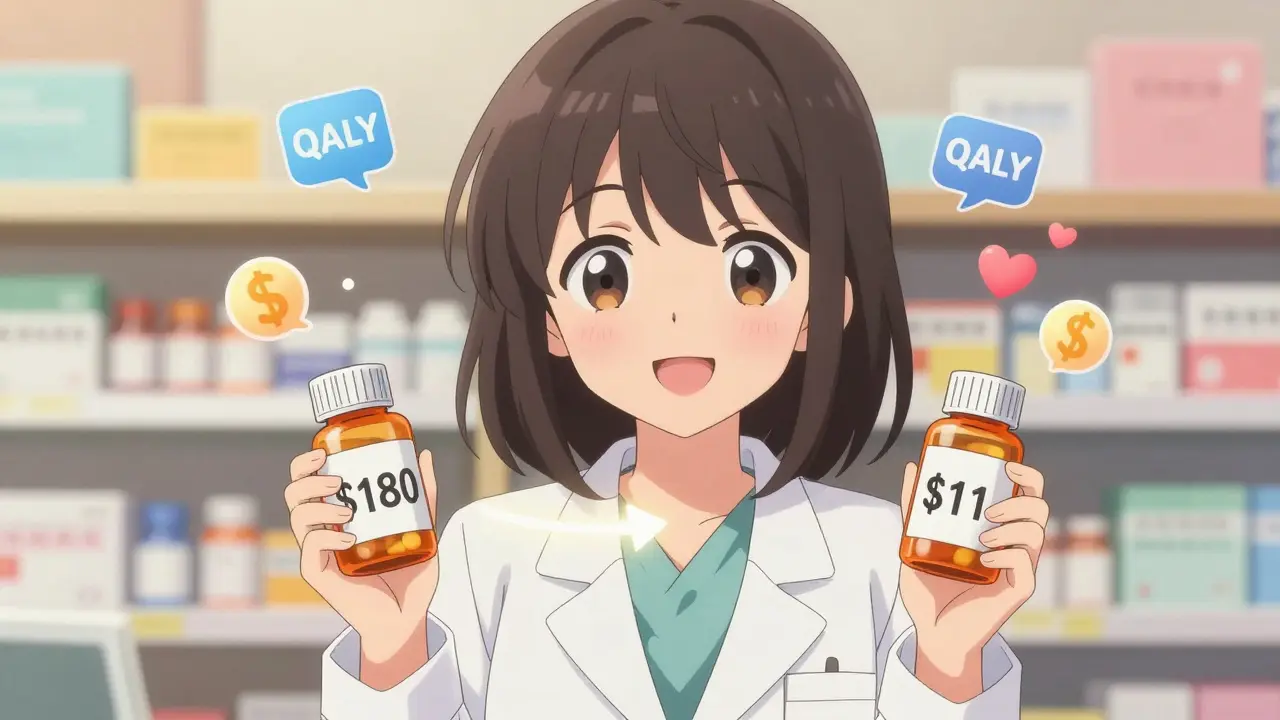
You’d think that if two drugs are chemically identical, they’d cost the same. But they don’t. A 2022 study in JAMA Network Open looked at the top 1,000 generic drugs in the U.S. and found something shocking: 45 of them were priced more than 15 times higher than other generics in the same therapeutic class - even though they did the exact same thing. One example: a generic version of a common blood pressure drug cost $180 for a 30-day supply. Another, identical drug from a different manufacturer cost $11. That’s a 16-fold difference. And it gets worse. The study found that when patients were switched from a high-cost generic to a lower-cost alternative in the same class, total spending dropped from $7.5 million to just $873,711. That’s an 88% savings - just by choosing a cheaper version of the same medicine. So why are we still paying the high price? Because of spread pricing.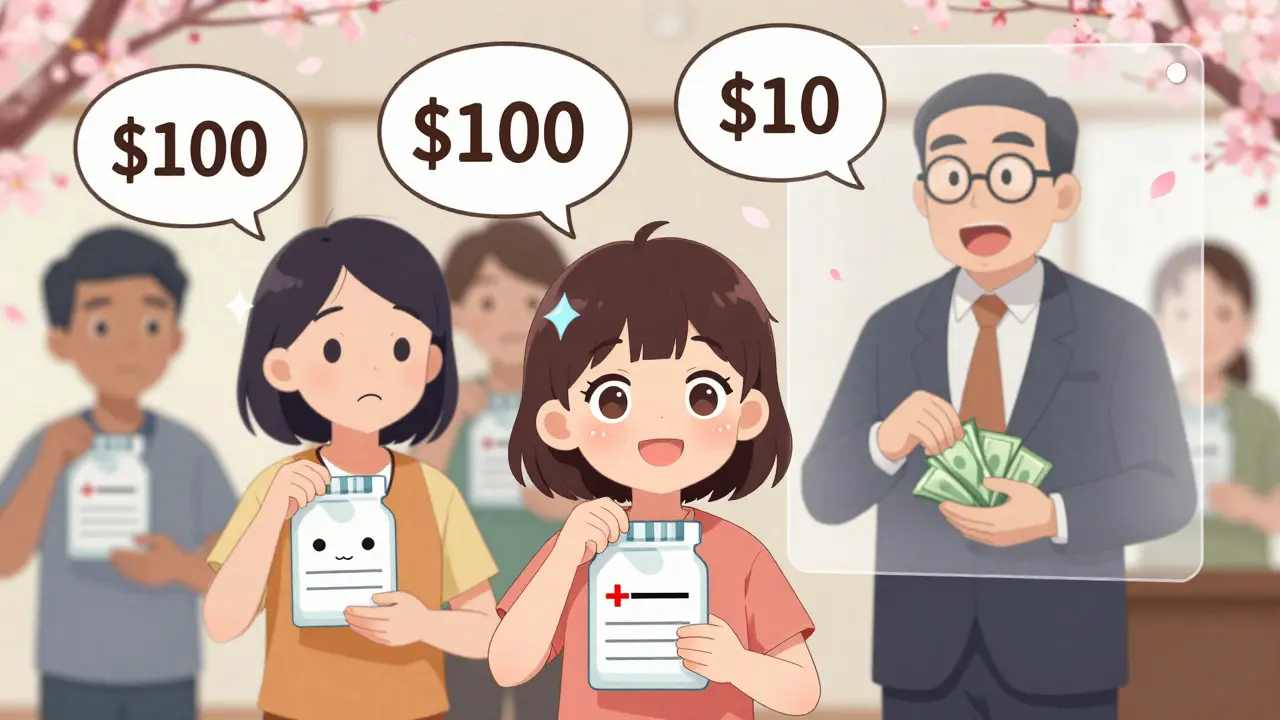
How Pharmacy Benefit Managers (PBMs) Keep Prices High
PBMs are middlemen between insurers, pharmacies, and drug manufacturers. They negotiate prices, manage formularies, and get rebates. Sounds helpful, right? Not always. Some PBMs use a trick called “spread pricing.” They tell the insurer they’re paying $100 for a drug. They pay the pharmacy $80. They keep the $20 difference as profit - even if a cheaper version exists for $10. That’s why you’ll see a high-cost generic on your insurance formulary. Not because it’s better. Not because it’s more effective. But because the PBM makes more money from it. This isn’t speculation. It’s documented behavior. And it directly undermines cost-effectiveness analysis. If your analysis says “choose the cheapest option,” but the system rewards the expensive one, then the analysis is being ignored.Therapeutic Substitution: The Secret Savings Tool
Here’s where things get really powerful. You don’t always have to switch to a generic of the same drug. Sometimes, switching to a different drug in the same class - a therapeutic alternative - saves even more. For example, instead of switching from a brand-name statin to a generic statin, you might switch to a different generic statin that’s cheaper, works just as well, and has fewer side effects. The JAMA study found that when patients were switched from a high-cost generic to a lower-cost therapeutic alternative, savings jumped to 90%. That’s not just a few dollars. That’s millions. And here’s the kicker: the price difference between therapeutic alternatives was 20.6 times higher than the difference between identical generics. That means there’s way more money to be saved by looking across drug classes than within them. Yet most formularies don’t encourage this. They’re built around “same drug, different brand” swaps. They ignore the bigger picture.Why the U.S. Lags Behind Europe
In Europe, over 90% of health technology assessment agencies use formal cost-effectiveness analysis to decide which drugs get covered. In the U.S., only 35% of commercial payers do. Why? Because the U.S. system is fragmented. Insurers, PBMs, hospitals, and government programs all make their own rules. There’s no national standard. No unified database. No consistent method. Meanwhile, countries like the UK and Germany have centralized agencies that review drugs, calculate ICERs (incremental cost-effectiveness ratios), and set clear thresholds. If a drug costs more than $50,000 per QALY, it doesn’t get funded - no exceptions. The U.S. doesn’t have a fixed threshold. So decisions are messy. Sometimes a drug gets covered because a doctor likes it. Sometimes because a PBM gets a rebate. Sometimes because the patient’s employer has a contract with a specific manufacturer. That’s not evidence-based. That’s chaos.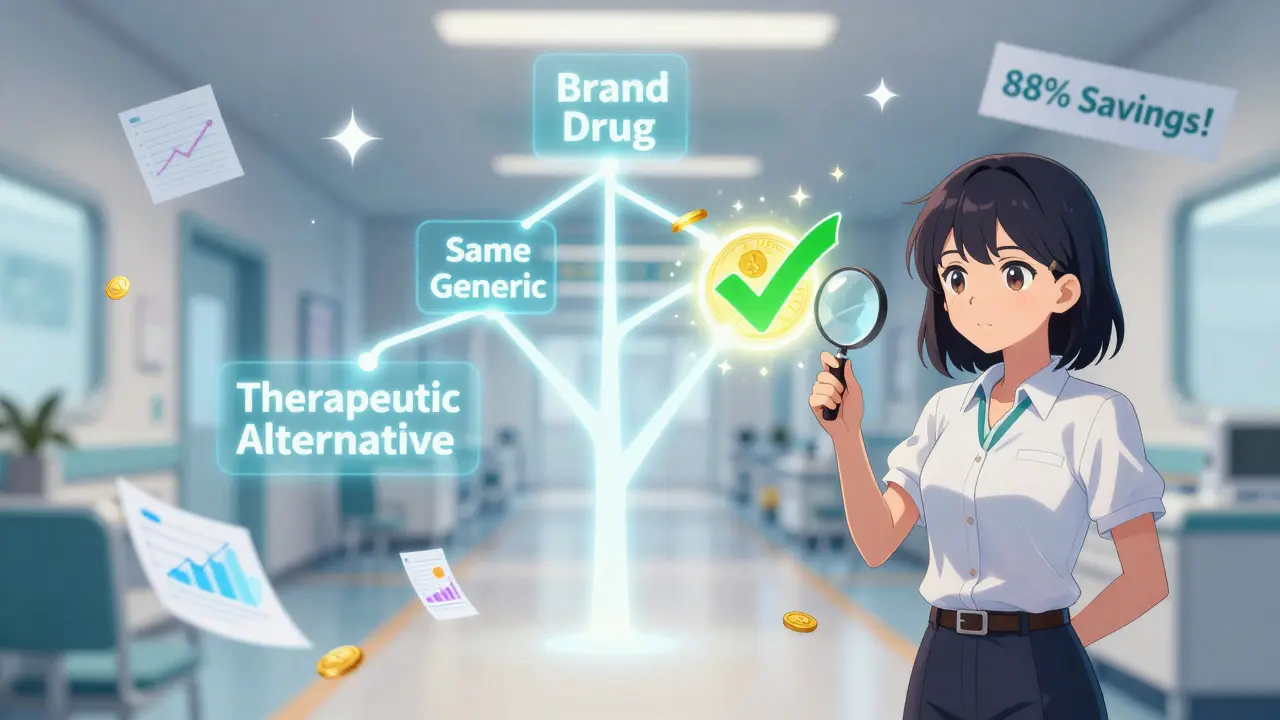
What Needs to Change
We know what works. We have the data. We’ve seen the savings. So what’s missing? First, analysts need to build future generic pricing into their models. If a drug’s patent expires in 12 months, the cost should reflect the expected price drop - not today’s inflated price. Second, formularies need to prioritize therapeutic substitution. Don’t just swap one generic for another. Look across the whole class. The cheapest option isn’t always the same drug - it’s often a different one. Third, transparency is key. PBMs should be required to disclose how much they profit from each drug. If a $10 drug is billed at $100, the public has a right to know why. Fourth, we need to stop letting drug companies game the system. The NIH warns that manufacturers set prices so that the ICER is just under the threshold decision-makers use. That’s not innovation - that’s manipulation.The Real Impact: Billions Saved, Lives Changed
The FDA estimates that generics saved the U.S. healthcare system $1.7 trillion between 2007 and 2017. That’s more than the GDP of South Africa. And yet, we’re still leaving money on the table. The JAMA study showed that just fixing the 45 high-cost generics they identified would save $6.6 million in a single year. Multiply that across all drugs - across all states - and you’re talking billions. But it’s not just about money. When a patient can afford their medicine, they take it. When they take it, they live longer. They go to work. They care for their families. They don’t end up in the ER because they skipped doses. Cost-effectiveness analysis isn’t cold math. It’s a tool to make sure people get the care they need - without bankrupting the system. And if we do it right - if we stop ignoring the future, stop rewarding overpriced generics, and start looking for real savings - we can make healthcare not just cheaper, but fairer.What You Can Do
If you’re a patient:- Ask your pharmacist: “Is there a cheaper version of this drug?”
- Ask your doctor: “Is there another drug in the same class that works just as well?”
- Use tools like GoodRx or SingleCare to compare prices across pharmacies.
- Require cost-effectiveness models to include projected generic pricing.
- Remove financial incentives for PBMs to favor high-cost generics.
- Adopt therapeutic substitution as a standard practice.
Comments (11)
Callum Duffy
March 3, 2026 AT 18:37
Interesting breakdown. I’ve worked in UK health policy for over a decade, and the contrast between our systematic HTA process and the U.S. free-for-all is stark. We don’t always get it right, but at least there’s a consistent framework. No one’s making a profit off spread pricing here - transparency is baked into the system. It’s not perfect, but it’s not chaos either.
Chris Beckman
March 5, 2026 AT 08:18
so like… pbms are just stealing from us? lmao. my insurance said my generic was $120 and then i checked goodrx and it was $8 at walmart. they kept $112. that’s not a middleman, that’s a mugger with a spreadsheet.
Levi Viloria
March 6, 2026 AT 17:27
There’s something poetic about how we’ve engineered a system where the cheapest solution is also the least profitable one. It’s like we built a machine that rewards inefficiency. The real tragedy isn’t the price difference - it’s that we’ve normalized it. People don’t even ask anymore. They just pay. And that silence? That’s the real cost.
Richard Elric5111
March 7, 2026 AT 18:56
One must consider the epistemological foundations of cost-effectiveness analysis itself. The QALY metric, while statistically robust, is predicated upon a utilitarian calculus that reduces human health to a quantifiable utility function - a reductionism that risks commodifying life itself. Furthermore, the assumption that market competition inevitably leads to equitable outcomes is empirically dubious, as evidenced by the persistent oligopolistic structures within pharmaceutical distribution. The very framework of CEA, then, may be complicit in obscuring deeper structural inequities.
Dean Jones
March 9, 2026 AT 18:37
Let’s not pretend this is just about money. This is about power. The reason we don’t fix this isn’t because we don’t know how - it’s because too many people are making too much money off the current system. PBMs, big pharma, even some insurers - they’re all part of a feedback loop where the more expensive the drug, the more rebates they get, the more they lobby to keep the system the way it is. And patients? We’re just line items on a spreadsheet. The fact that a $11 drug can be billed as $180 and no one bats an eye? That’s not a market failure. That’s a moral failure. And until we start treating healthcare like a public good instead of a profit center, nothing will change. Not legislation. Not studies. Not even data this clear.
Betsy Silverman
March 10, 2026 AT 02:55
I work in a community clinic. We had a patient who was skipping her blood pressure meds because the generic cost $170/month. We switched her to the $11 version - same active ingredient, same side effects. She cried because she hadn’t been able to afford her meds in two years. That’s not economics. That’s humanity. We need to stop pretending this is about spreadsheets. It’s about people who can’t choose between medicine and rent.
Ivan Viktor
March 11, 2026 AT 17:22
So let me get this straight - we have a system where the government won’t pay for a drug because it’s ‘not cost-effective,’ but the same drug costs 16x more just because the PBM got a kickback? And we’re surprised people are broke? I mean, I get it. It’s like if your car mechanic told you the fix was $200, but he paid $10 for the part and kept $190. And then sued you if you tried to fix it yourself. Welcome to America.
Zacharia Reda
March 12, 2026 AT 01:14
Therapeutic substitution is the quiet hero here. Why are we still stuck on ‘same drug, cheaper brand’? It’s like trying to save money by switching from a Ford to a Chevy when you could just take the bus. The real savings are in the alternatives - the different statins, the different beta-blockers. We need formularies that force pharmacists to ask, ‘Is this the cheapest option in the whole class?’ not ‘Is this the cheapest version of this exact pill?’
Jeff Card
March 12, 2026 AT 23:10
My sister died because she couldn’t afford her insulin. Not because there wasn’t a generic. Not because it didn’t exist. Because the pharmacy charged her $450 and the PBM kept $400 of it. I read this whole thing and all I can think is - we knew this. We’ve known this for years. And we did nothing. That’s not negligence. That’s cruelty dressed up as policy.
Matt Alexander
March 13, 2026 AT 22:09
Simple fix: make PBMs disclose their profit per drug. If everyone can see how much they’re skimming, the system breaks. No more hiding behind ‘negotiation.’ Just show the numbers. Let the market react. Patients will vote with their feet - and pharmacies will stop carrying the overpriced stuff.
Stephen Vassilev
March 14, 2026 AT 05:47
Wait - this is all just the tip of the iceberg. Did you know that PBMs often have exclusive contracts with manufacturers who pay them to block competing generics? And that some of these PBMs are owned by the same companies that make the brand-name drugs? It’s a closed loop. A cartel. And the FDA? They’re powerless. The system isn’t broken - it was designed this way. To funnel money from patients to shareholders. You think this is about cost-effectiveness? It’s about control. And if you think reform is coming? You’re not seeing the full picture.